King Tut PBR Bull in 2026: Scores, Buckoffs and the Anaheim Breakout
Understand King Tut's 2026 Teams outings, Leather's 93.35 ride, Batista's 46.70 bull score and the dated six-out statistical snapshot.
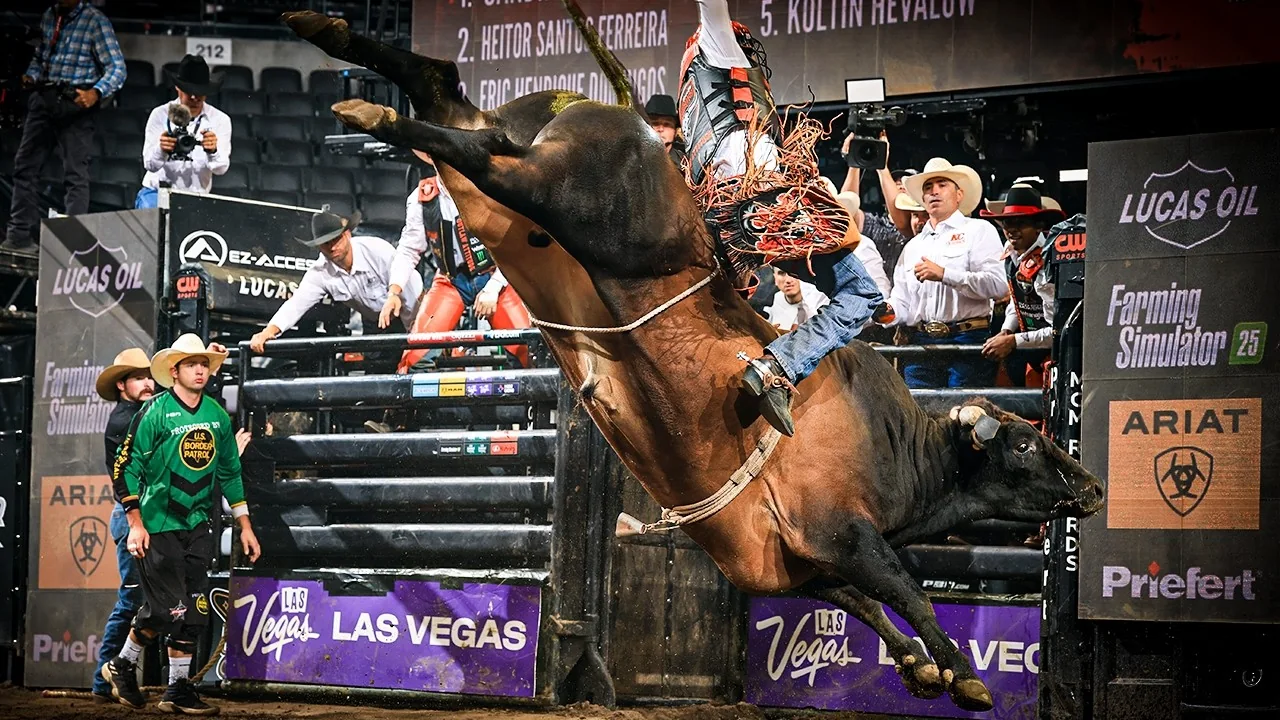
King Tut's 2026 Anaheim breakout paired Macaulie Leather's 93.35-point ride with a later 46.70 bull score against Sandro Batista. Those numbers describe separate outings. Leather's ride carried a 45.10 bull component; Batista's encounter ended in a buckoff. Keeping the outings apart explains why the same bull appears in two strikingly different highlights.
This guide follows those cases, Alan de Souza's earlier success and a dated Teams statistical snapshot to show what makes King Tut worth watching. You will see how individual scores affected the games, what the buckoff percentage actually represents, and how to compare the next matchup with the completed encounters. Current lineup information is reviewed as of October 1, 2026.
Why King Tut became a bull to follow in 2026
King Tut appears on PBR's official bull profile under Less Than 8 Cattle Co. His Anaheim appearances offer a useful introduction to following a bull: a rider can succeed against a challenging animal, while another outing can end quickly and still earn the bull a strong grade. That combination makes the matchup worth watching beyond the rider's name.
A bull profile becomes more useful when you treat each out as its own sporting encounter. Ask who rode, which game contained the matchup and what the result measured. Those questions separate a successful partnership from a buckoff, and a team's score from the bull's performance. They also give you something concrete to revisit when the same animal appears opposite a different rider.
The Leather highlight and Batista highlight are an especially revealing pair. Watch the outcome first, then return to the start and follow how long the encounter develops. A completed ride gives you a longer sequence to consider; a short buckoff concentrates attention on the opening exchange. Neither viewing experience needs a prediction about the next rider to be interesting.
For a team supporter, the bull's name also changes the anticipation around one slot in a lineup. You can be interested in the animal's performance while wanting your rider to put points on the board. Those interests coexist. A dramatic successful ride rewards the rider's execution and gives the audience a chance to appreciate the opponent; a buckoff changes the game without turning the entire bull profile into a single win-or-loss label.
The cases below provide a practical way to build that perspective: start with the completed Anaheim scores, compare the earlier Oklahoma City success, and then consider the dated statistical snapshot. The goal is to recognize what makes an outing consequential, rather than attach a permanent reputation to one photograph or one number.
Macaulie Leather's 93.35: the Anaheim ride that changed the game
Leather rode King Tut for 93.35 points in Anaheim's opening-day Game 2 on September 11. The official result lists a 45.10 bull score for that out. In its September 22 retrospective, PBR identified the ride as the highest of the 2026 Teams season to that point.
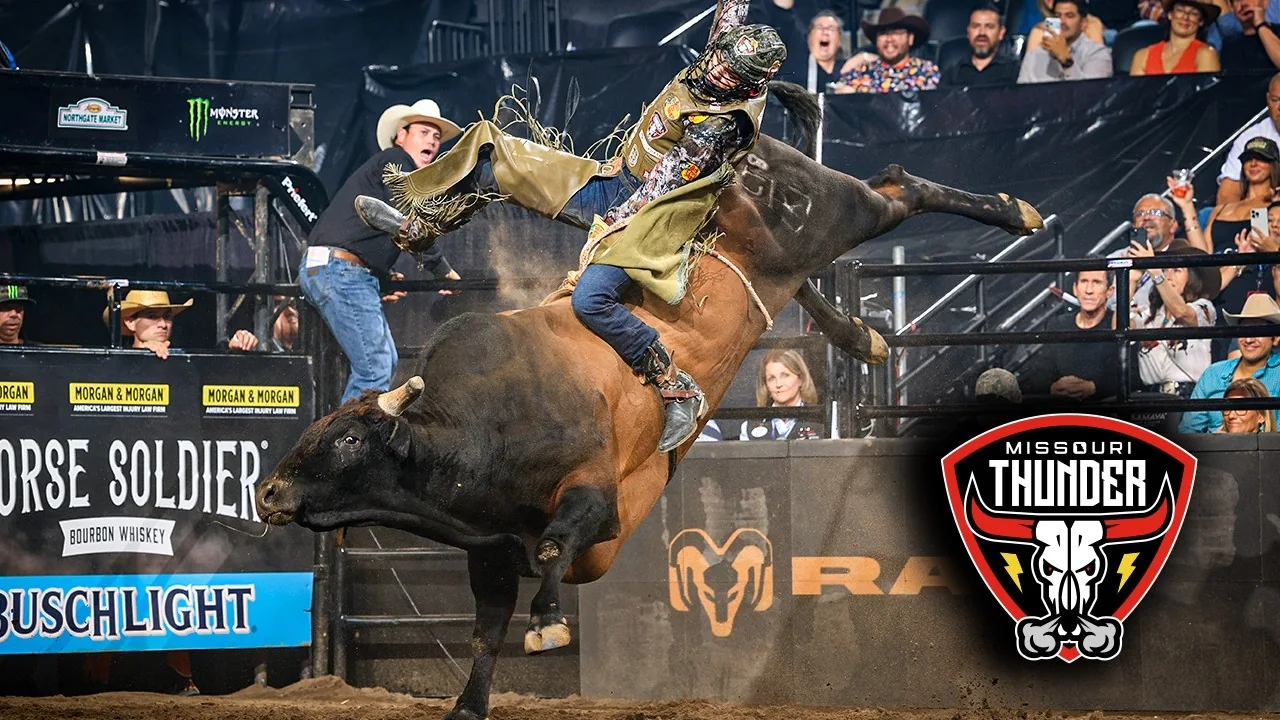
The ride has two levels of interest. Viewed alone, it is a standout score to replay and compare with other successes on the same bull. Viewed within the game, it becomes one contribution to a team's total. Moving between those perspectives is what gives a Teams highlight its depth: you can admire the individual encounter and then see exactly where its points sit beside the other completed rides.
How the ride fitted Missouri's 272.65-point total
Missouri beat Carolina 272.65–89.50. The Thunder's scoring rides were Paulo Eduardo Rossetto's 90.75 on Fury, Leather's 93.35 on King Tut, and Ednélio Rodrigues' 88.55 on Dirty Honey in the reride results. Their sum is 90.75 + 93.35 + 88.55 = 272.65.
Leather therefore supplied approximately 34.24% of Missouri's final total. He had the largest of the three scores, but the difference between the highest and lowest was only 4.80 points. That is a useful way to appreciate the quality of the collective performance: the spectacular highlight sits alongside two substantial contributions, rather than accounting for nearly the entire team score.
The winning margin was 183.15 points. Removing Leather's score from the arithmetic leaves 179.30, still above Carolina's recorded total. That calculation is not an alternate game result; it simply shows why calling the highlight the team's only reason for winning would overstate its role. Missouri's three completed scoring rides belong in the explanation together.
When rewatching, keep both scales in mind. The individual score explains the excitement around King Tut and Leather. The sum explains Missouri's strength in that game. You get a fuller sporting story by seeing how a memorable out fits the evening's other work.
Sandro Batista's buckoff and King Tut's 46.70 bull score
On September 13, Anaheim's Day 3 Game 1 paired Kansas City's Sandro Batista with King Tut. The result lists 2.11 seconds and a 46.70 bull score. PBR's official clip identifies it as a buckoff.
Under PBR's scoring basics, bulls receive scores up to 50 even on buckoffs; riders need eight seconds to earn a score.
Why 46.70 is not the bull component of Leather's ride
The simplest comparison keeps a separate row for each encounter. Leather's Anaheim out produced a completed total and its own bull component. Batista's produced a time and a different bull grade. Joining the largest numbers from the two rows would invent a performance that never occurred.
| Rider and outing | Completed ride total | Bull score | Buckoff time |
|---|---|---|---|
| Leather, Anaheim Day 1 | 93.35 | 45.10 | Not a buckoff |
| Batista, Anaheim Day 3 | No qualified score | 46.70 | 2.11 seconds |
The bull grades differ by 1.60 points. That comparison describes the two recorded outings; it does not revise the earlier ride. For the same reason, dividing the buckoff time by a score produces no useful sporting measure. Duration, successful ride total and bull grade are different pieces of information, each with a purpose.
What to compare when watching the two Anaheim clips
Begin each clip at normal speed so the pace of the encounter remains visible. Then return to the opening segment and follow the rider's position relative to the bull through successive movements. In the shorter encounter, note when the rider separates; in the completed one, follow how the partnership continues. Pausing can help you see a moment, but the moving sequence provides the context around it.
Let the recorded result settle the outcome while the footage helps you appreciate the action. A dramatic still can capture a difficult instant in either a successful ride or a buckoff. It cannot, by itself, tell you how the entire encounter finished. Watching both clips also makes a useful question possible: what changed between the encounters? You can consider that question without assuming the next rider will face an identical sequence.
Alan de Souza's 89.35 shows the other side of the matchup
Before Anaheim, Alan de Souza rode King Tut for 89.35 at Wildcatter Days in Oklahoma City. PBR's highlight identifies Day 3, Game 3. The August 2 game report places the ride in Nashville's 358.50–90.20 win over Kansas City, with de Souza scoring in the first frame.
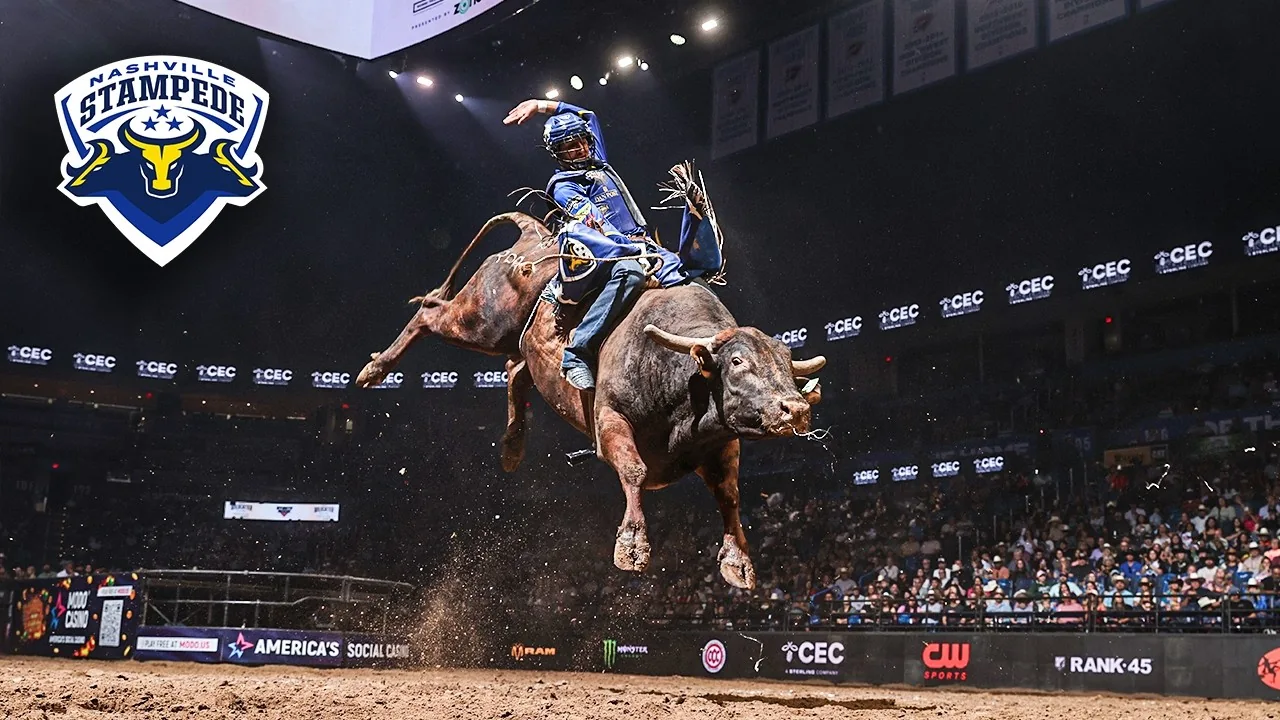
PBR's Wildcatter Days analysis records a 43.25 bull score on de Souza's out. This earlier result adds an important comparison: Leather's headline was not the only successful encounter with King Tut in the Teams season.
The completed totals differ by 4.00 points, while the two bull grades differ by 1.85. Those are comparisons between recorded performances, rather than a ranking of the riders' overall ability. They show why a bull's name alone cannot supply an expected total. The encounter still has to happen, and its particular performance still has to be evaluated.
De Souza's 89.35 was 0.65 below the familiar 90-point milestone. For a supporter watching a team game, that small gap should not obscure the contribution. It is easy for a round-number headline to determine which clip gets replayed, yet the score retains its full value in the team's arithmetic. A ride just below a milestone can matter substantially to the larger result.
Nashville's four scoring rides were 89.35, 91.85, 88.20 and 89.10, totaling 358.50. De Souza's contribution was approximately 24.92% of that sum. The spread between the highest and lowest was 3.65, another example of several strong performances supporting one another. This game offers a different scale from Missouri's Anaheim win: the bull matchup is an opening contribution within a four-ride performance.
To compare the clips use two passes. First, follow each encounter from start to finish and register its outcome. Second, compare how the successful sequences develop over time, rather than focusing only on the most dramatic freeze-frame. The earlier success gives you another complete example to consider alongside Leather's. Batista's short encounter adds a different outcome, making the set more informative than three clips selected solely for their biggest numbers.
That comparison is useful even if you have no allegiance to Nashville or Missouri. It turns the bull from a name attached to a headline into an opponent you can follow across encounters, with a record that includes both rider success and failure.
Was King Tut undefeated in the 2026 Teams season?
No. PBR's September 15 feature recorded two successful rides in six Teams outs, a 66.67% buckoff rate and the No. 2 position in the league's bull standings. That is a dated Teams snapshot, rather than a complete final-season or all-tour record.
The successful encounters discussed above already answer the undefeated question. A bull can remain a difficult and compelling opponent after a rider covers him. The more useful discussion concerns what the performances tell you, and how much confidence a small set of outings can support.
Two rides, four buckoffs and a small sample
Subtracting two successful rides from six outs leaves four buckoffs. Four divided by six is 0.6667 when rounded, or 66.67%. The corresponding successful-ride rate is approximately 33.33%. Showing both counts makes the percentage easier to interpret: the snapshot contains six encounters, not hundreds.
A hypothetical seventh out demonstrates the sensitivity of that denominator. If it ended in a buckoff, the record would become five buckoffs in seven, approximately 71.43%. If it ended in a successful ride instead, it would be four buckoffs in seven, approximately 57.14%. Neither figure is a claim about what happened next. They are two possible extensions of the same six-out example.
The difference between those hypothetical rates is approximately 14.29 percentage points. That is a large change from one encounter, despite no change to the first six. It explains why the raw count deserves attention whenever a short-season percentage looks definitive. A new out adds information, but its result does not transform the earlier matchups into something else.
For the next rider, the snapshot also leaves questions open. Were the previous successes long, composed sequences or narrowly completed encounters? How did the bull perform in the specific clips you are comparing? The historical percentage supplies an overview; the individual cases supply the sporting detail. Together they make a better viewing companion than treating a rate as a forecast.
A difficult bull can still produce a successful ride
The contrast between the completed rides and the Batista buckoff gives King Tut's profile its interest. Rider success and an impressive opponent can appear in the same encounter. A failure on a different day adds another result without cancelling the earlier success. That makes the profile more informative than simply calling the bull beatable or unbeatable.
Similarly, the September ranking should stay attached to September. It tells you how the bull was positioned in that published snapshot, while a final championship would answer a later, separate question. For a fan following the season, the practical response is to keep watching the specific outings: acknowledge the successes, appreciate the difficult encounters, and let subsequent performances add to the record.
How to follow King Tut's next PBR matchup
At this guide's October 1 review, PBR's Teams lineup lists Thiago Salgado against King Tut in opening-day Game 4 at Rattler Days, Carolina versus Austin. The October 2–4 event's game is marked upcoming, with no completed scores. The listed assignment can change before the out.
That matchup offers a fresh encounter to compare with the three cases above. Before it happens, the interesting question is how Salgado will respond to the opponent. Afterward, the useful question is what actually unfolded. Keeping that transition in mind lets you enjoy the anticipation without treating an earlier highlight as a script for the next appearance.
Check the rider, game and result together
Start with the matchup on the event day. The today page helps locate the day's action, while the PBR daysheet guide explains how to read the sporting information. Keep the bull's name and rider together as you move from the advertised encounter to the completed result. If an assignment changes, the actual opponent becomes the relevant comparison.
After the out, consider three questions. Did the encounter produce a completed ride or a buckoff? What grade did the bull receive? How did the result fit the game? The first question describes the outcome, the second adds the bull's performance, and the third explains why the moment mattered to the supporters in the arena. You can answer all three without compressing the encounter into a single dramatic number.
A simple personal comparison can contain an event date, rider, outcome, bull grade and one observation from the clip. Keep the observation specific: perhaps the point where the sequence changes or the final moments of a successful ride. It is more useful than a sweeping statement about what every future rider must do. Returning to the earlier clips then gives you a clear basis for noticing similarities and differences.
The game situation also changes what a supporter hopes to see. In a hypothetical game needing 91 points to move ahead, an 89-point completion would be appreciated differently from the same performance in a game needing 85. Those are illustrative numbers, not a prediction for Salgado. They show how a completed ride can be judged as an individual achievement and considered within the team's immediate needs.
Continue following King Tut's official profile alongside the individual encounters. The appeal of this bull is already visible in the contrasting cases: successful riders have produced memorable performances, while a different encounter ended rapidly. The next out is another sporting chapter to watch on its own terms.
Keep reading
Related PBR articles
Riders & Bulls
PBR Australia 2026 Title Race: Shephard, Hall and the Run to Townsville
By PBR Schedule Editorial TeamRiders & Bulls
Jean Carlos Teodoro's 2026 PBR Teams Rookie Award: What He Won and Why It Matters
By PBR Schedule Editorial TeamRiders & Bulls
Join the conversation
Comments
Comments are reviewed before publication. Keep the discussion useful, respectful and focused on bull riding.
Sign in with Google to comment
Your public comment shows your account name. Your email address is not displayed.
Commenting as
Loading comments…